Is your listing in the lists below? Why not?
We are helping property managers or vacational rental owners to increase their revenue up to 50%. We know everything about your competitors. Our algorithm let's your listing to be the most booked in Sydney within a few minutes. If you want to increase your listing's performance on AirBnB we will be waiting for you.
Interesting data of Sydney on AirBnB
Here we go! For Sydney we are listing you some interesting data freely to let you understand the power of RentalProf. Managing business on Airbnb without our endless data visualisation support makes you lost and earn less on Airbnb. If you have listing in Sydney please check the charts prepared for Sydney carefully.
Do you have any idea about how many listings have been booked in last 24 hours in Sydney?
This chart will help you to learn more about what is going on in your city instantly. Rentalprof is providing many data visualisation methods to ease your business according to your needs.
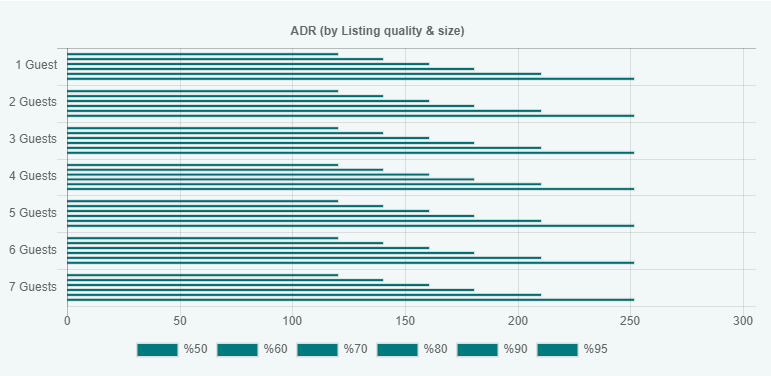
Here is the ADR percentile for Sydney Do you know how to read it?
This chart will help you to learn more about what is going on in your city instantly. Rentalprof is providing many data visualisation methods to ease your business according to your needs.
| ADR | 1 Guests | 2 Guests | 3 Guests | 4 Guests | 5 Guests | 6 Guests | 7 Guests |
|---|---|---|---|---|---|---|---|
| %50 | 52 € | 68 € | 81 € | 102 € | 119 € | 135 € | 166 € |
| %60 | 62 € | 75 € | 89 € | 111 € | 129 € | 148 € | 187 € |
| %70 | 80 € | 85 € | 97 € | 122 € | 144 € | 160 € | 217 € |
| %80 | 103 € | 96 € | 108 € | 138 € | 161 € | 181 € | 247 € |
| %90 | 148 € | 119 € | 131 € | 172 € | 187 € | 214 € | 308 € |
| %95 | 184 € | 142 € | 155 € | 200 € | 217 € | 246 € | 392 € |
Do you have any idea about how many listings have been booked in last 24 hours in Sydney?
This chart will help you to learn more about what is going on in your city instantly. Rentalprof is providing many data visualisation methods to ease your business according to your needs.
Do you have any idea about how many listings have been booked in last 24 hours in Sydney?
This chart will help you to learn more about what is going on in your city instantly. Rentalprof is providing many data visualisation methods to ease your business according to your needs.
Do you have any idea about how many listings have been booked in last 24 hours in Sydney?
This chart will help you to learn more about what is going on in your city instantly. Rentalprof is providing many data visualisation methods to ease your business according to your needs.
Do you have any idea about how many listings have been booked in last 24 hours in Sydney?
This chart will help you to learn more about what is going on in your city instantly. Rentalprof is providing many data visualisation methods to ease your business according to your needs.
You can see top rated listings of Sydney on Airbnb in table below for the last month.
You can see top rated hosts of Sydney on Airbnb in table below for the last month.